Which drugs make money, and which lose it?
The short answer
For a practice that buys and bills its own infusion or injectable drugs, Practice KPIs sets what each billed drug cost against what it brings in: collected so far plus what is still expected, against the drug's cost from your distributor's purchase report. You see it by drug, and each drug opens to its insurer types.
How it is counted
- Cost comes from the purchase report you add (McKesson's today). It is before rebates and every other cost, so this is gross margin.
- Cost is counted when a drug is billed. Purchases in a month with no drug billed are stock until then, not a loss.
- What it brings in is what has been collected plus what the app still expects for those visits. A month too recent to forecast shows no margin yet.
- Against Medicare. Each drug's cost per unit is shown next to Medicare's payment limit per unit.
- Gaps are listed. Drugs bought and not billed, and drugs billed with no price in the purchase report.
What you see
Collections and drug cost by month, gross profit and gross margin, and a table of every drug with its cost per unit, collections and margin. It exports to Excel.
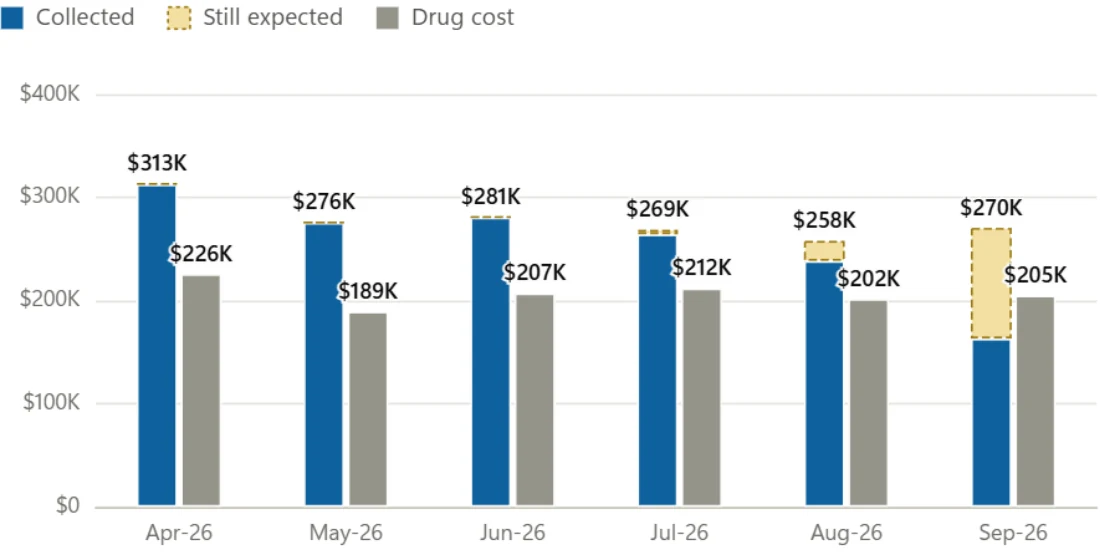
Collections and drug cost by month. Sample practice, invented data.
Open Gross margin in the live demo. The demo is the real app on a made-up practice.
What it needs
Your distributor's purchase report, added beside the two eBO reports the app already reads. Gross margin is an optional extra page: it appears once that report is in.